Management Software

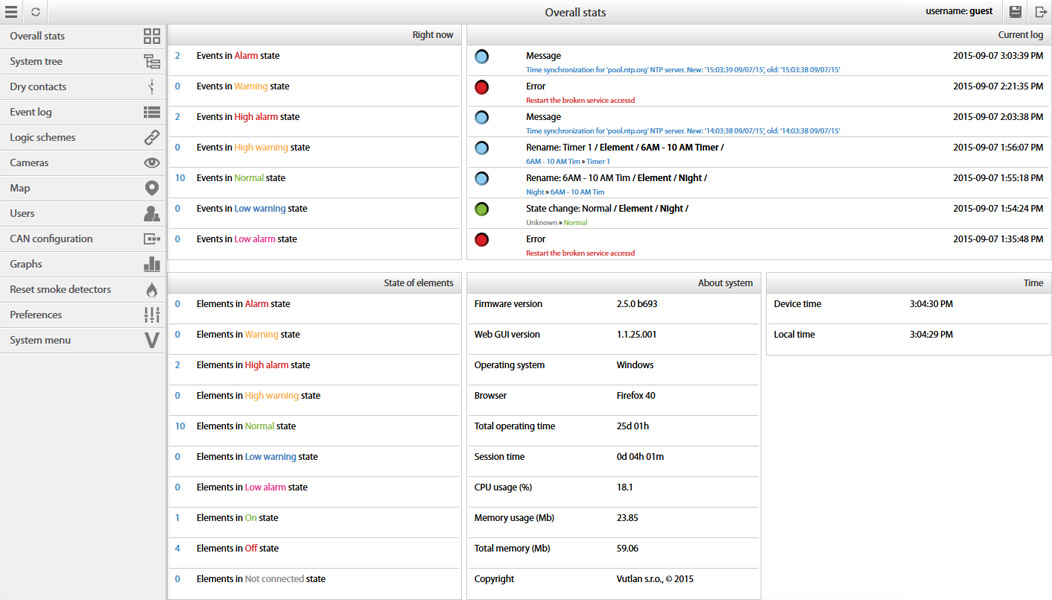
Web Embedded Interface

Our web interface is flexible enough to empower you with you with all the tools you need to monitor and control your mission critical facility. It is embedded in each remote monitoring unit and can be accessed with IP address inside your browser.

Simplicity&flexibility

The interface is built-in inside every Vutlan monitoring unit. Simply type in the IP address of the unit in the browser. Real time dashboards with live update and status information. Menu is divided into sections: Overall Stats, System Tree, Dry Contacts, Event Log, Logic Schemes, Cameras, Map, Users, CAN configuration, Graphs, Outlets, Preferences, System Menu.

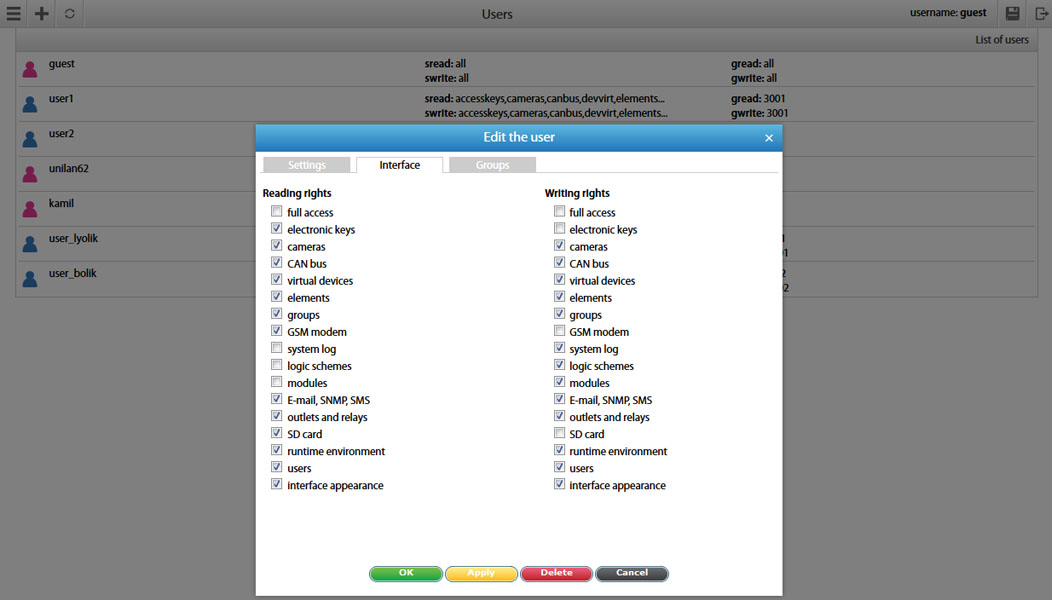
User Access and Permissions

Using "view" and "write" rights, user access can be restricted to the subsystems of the device using groups of access permission. User access can also be restricted to a specific group of sensors, which is defined by the administrator. This allows to define users for view or control of specified subsystems, allowing clients or employees to be in charge of monitoring their own equipment or part of a facility.


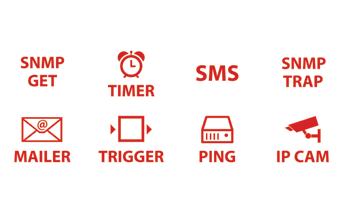
Advenced Notifications & Alerts

7 notification technologies: Send Email, SMS, Syslog, Event log, SNMP Trap, SNMP Get, sound and light an alarm beacon or a strobe light. Alerts bases on thresholds (warning, alert, normal). Multiple condition alerts. Escalation alerts (extra notifications every x min during downtime). Dependencies (avoid alarm floods). Alert Scheduling (based on time of the day).


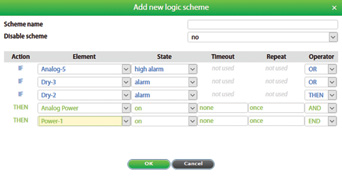
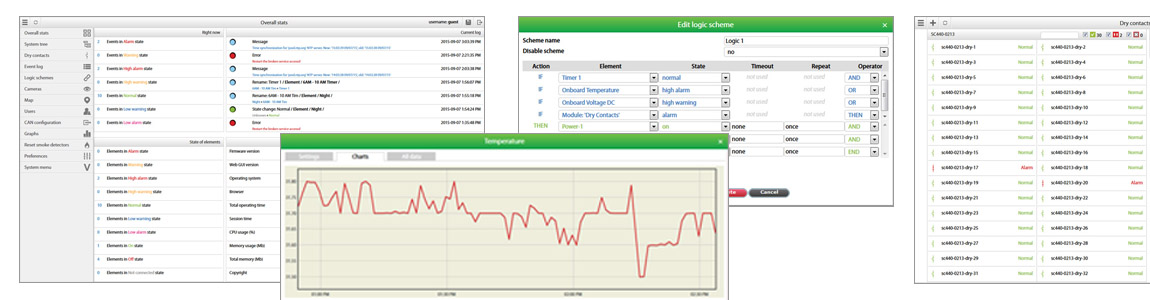
Configurable Logic Schemes

vutlan ortam izleme yapılandırılabilir mantık şemaları

Logic schemes are used to specify automatic actions to events that occur in the system.Logic schemes represent a set of conditions "IF" and a set of actions that are executed "THEN". Conditions can be combined using "AND" and "OR". For Example: you have a telecommunication rack with servers and equipment. You need to activate fans inside a rack when temperature reaches 36°C. If temperature reaches 44°C you need to activate second fan and to notify the administrator via e-mail and SMS.


Virtual Sensors& Elements
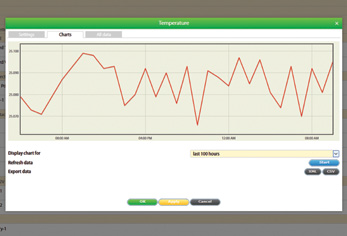
vutlan ortam izleme sanal sensörler ve elemanlar9 virtual elements: Group (for structural organization of elements), E-mail (message), SNMP trap (message), SMS (message), Timer (for planning of events), Trigger (for connecting two logic schemes), PING (probing), SNMP Get (request to query for information), IP Cam (surveilance).

Sensor Graphing

vutlan ems sensor grafikleri

Detailed graphs and data tables for one or more sensors using multi-plot graph. Each graph shows data for last 100: seconds, minutes, hours, days.


Multi Languages Supports

vutlan ortam izleme çoklu dil sesteği

Our web interface is available in English, Russian, Turkish, German, French, Italian, Spanish, Czech, Polish and Korean. If you require another language, it is easy to make a translation using *.json translation file.